Unlock Your Business’s Full Potential: How Sales Mapping and Data Visualization Drive Scalability in 2026
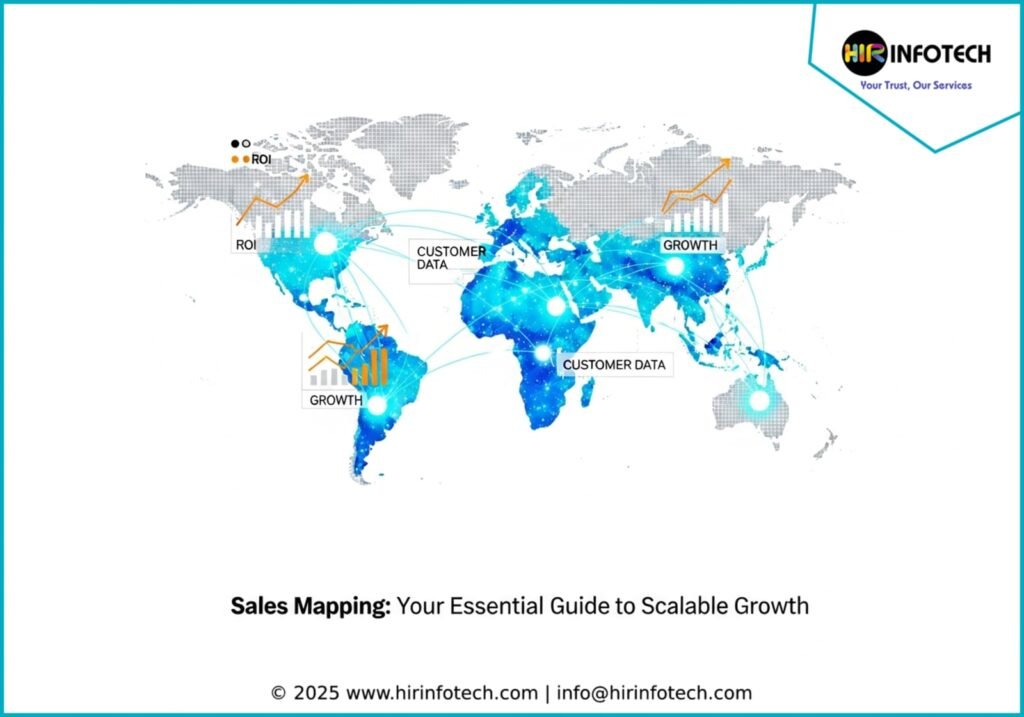
In today’s data-driven world, businesses are constantly searching for innovative ways to gain a competitive edge. Data visualization tools have emerged as a powerful ally, transforming complex datasets into actionable insights. Companies leverage this technology for everything from tracking market trends to refining business operations. While its application in content marketing is well-known, one of its most impactful yet underutilized benefits lies in sales mapping. For businesses aiming to scale, understanding where to focus their sales efforts is paramount. Data visualization tools, including heat maps, provide a clear geographical representation of sales data, empowering companies to allocate resources with precision and unlock new growth opportunities.
As we move further into 2026, the ability to harness big data is no longer just an advantage; it’s a necessity. Sales territory mapping, a traditionally complex process, is now streamlined through sophisticated data visualization software. This technology helps sales teams stay organized, adapt to fluctuating economic landscapes, and make informed decisions. By visualizing customer data, businesses can strategically design sales territories, manage client information effectively, and monitor economic shifts. The advantages are numerous, enabling companies to pinpoint customer concentrations, identify emerging markets for expansion, and meticulously calculate the return on investment (ROI) of their sales initiatives.
The Strategic Advantages of Sales Mapping Data Visualization
In the competitive landscape of 2026, leveraging every available tool to enhance efficiency and effectiveness is crucial for business scalability. Data visualization techniques, particularly in the realm of sales mapping, offer a significant strategic advantage. By transforming raw data into intuitive visual formats, companies can uncover hidden patterns, make more informed decisions, and ultimately drive growth.
Gaining Unprecedented Flexibility in Territory Management
One of the most significant benefits of modern sales mapping software is the enhanced flexibility it offers to sales teams. Traditional territory management often relies on rigid, predefined boundaries that can stifle optimization and hinder a salesperson’s ability to adapt to changing market dynamics. In contrast, data visualization tools empower sales professionals to define and manage their territories using a variety of dynamic criteria.
Imagine a sales team no longer bound by simple geographical lines. With advanced mapping software, they can now create territories based on:
- Customer Demographics: Targeting specific age groups, income levels, or other demographic factors that align with your product or service.
- Purchasing Patterns: Focusing efforts on areas with a high concentration of customers who have previously shown interest in similar products.
- Competitor Activity: Strategically positioning sales efforts to capitalize on competitor weaknesses or avoid saturated markets.
This level of flexibility allows for a more agile and responsive sales strategy. Sales teams can continuously refine their territories based on real-time data, ensuring that their efforts are always directed towards the most promising opportunities. This adaptability is a cornerstone of scalable growth in the modern business environment.
Deepening Your Understanding of Your Customers
A fundamental principle of business growth is to know your customer. This means understanding not just who they are, but also what they need, what drives their purchasing decisions, and where they are located. Sales mapping, powered by data visualization, provides a powerful lens through which to view and understand your customer base.
By plotting customer data on a map, you can gain immediate insights into:
- Geographic Concentrations: Easily identify where the majority of your customers are located, allowing for targeted marketing and sales campaigns.
- Untapped Markets: Discover new areas with a high potential for growth, guiding decisions on where to establish a physical presence or focus digital marketing efforts.
- Regional Preferences: Analyze purchasing habits across different locations to tailor your offerings and marketing messages to specific regional tastes.
When working with business-to-business (B2B) clients, you can segment territories by industry or company size. For business-to-consumer (B2C) sales, you can focus on specific neighborhoods or demographic groups. This granular understanding of your customer landscape is invaluable for crafting a targeted and effective growth strategy. For a deeper dive into how customer journey mapping can boost ROI, explore this insightful article from WeWork.
Elevating Your Analytical Capabilities
A well-defined sales territory is a consistent revenue-generating engine. Sales territory mapping software provides businesses with the analytical tools needed to not only identify but also continuously optimize these territories for maximum efficiency. The ability to conduct a thorough analysis of customer and sales data is what transforms a good sales strategy into a great one.
Data visualization tools offer several layers of analytical depth:
- Performance Tracking: Monitor sales performance within each territory over time to identify trends and measure the impact of strategic adjustments.
- Fine-Tuning Boundaries: Use data-driven insights to make precise adjustments to territory boundaries, ensuring a balanced workload and maximizing opportunities for each sales representative.
- Holistic Sales Approach: Combine various data points, such as customer lifetime value, sales cycle length, and conversion rates, to create a comprehensive picture of your sales operations.
This enhanced analytical capability turns sales mapping into a powerful strategic weapon. Business owners can ensure that territories are not only clearly defined but also practical and effective. By enabling a deep dive into customer and sales data, these tools empower you to refine your sales approach, optimize your territories, and ultimately, drive sustainable growth.
Harnessing the Power of Comprehensive Data Analysis
To unlock true growth potential and achieve scalability, it is essential to have a deep and comprehensive understanding of your existing sales performance. This involves a multi-faceted approach to data analysis, looking not only at your own sales figures but also at customer behavior and the competitive landscape.
Analyzing Your Sales Data for Profitable Insights
The first step in any effective growth strategy is to analyze your current sales data to identify where your most profitable sales are originating. Ask yourself critical questions:
- Are there specific geographic regions that consistently outperform others?
- Do certain customer segments contribute a disproportionately high amount of revenue?
- Are you underperforming in any areas that, based on market data, should be strong?
The primary objective of this analysis is to determine where to concentrate your sales and marketing efforts for the highest possible return on investment. By pinpointing your most lucrative markets, you can allocate resources more effectively and develop targeted strategies to further penetrate these areas.
Creating a Detailed Profile of Your Ideal Customer
Once you have a clear picture of your most profitable sales, the next step is to delve into your customer data. The goal is to create a detailed profile of your ideal customer. This profile should include:
- Demographic Information: Age, gender, income level, education, and other relevant demographic details.
- Psychographic Information: Lifestyle, values, interests, and pain points.
- Behavioral Information: Purchasing habits, brand loyalty, and online behavior.
By developing a comprehensive understanding of your target audience, you can tailor your marketing messages and sales approach to resonate with their specific needs and desires. This customer-centric approach is crucial for building long-term relationships and driving repeat business.
Gaining a Competitive Edge Through Competitor Analysis
Finally, it is essential to analyze your competitors’ data. Understanding their strategies and target markets can reveal new opportunities for your own business. Key areas to investigate include:
- Target Audience: Who are your competitors selling to? Are there any underserved segments of the market that you could target?
- Geographic Focus: Where are your competitors concentrating their efforts? This can help you identify less competitive markets or areas where you can challenge their dominance.
- Marketing and Sales Tactics: What strategies are they using to attract and retain customers? Analyzing their successes and failures can provide valuable lessons for your own approach.
By understanding the competitive landscape, you can identify opportunities to differentiate your business, minimize direct competition, and carve out a unique space in the market. To learn more about how to turn your data into actionable insights, check out this valuable resource from Forbes Advisor.
This three-pronged approach to data analysis—examining your own sales, understanding your customers, and evaluating your competitors—provides the comprehensive insights needed to build a robust and scalable growth strategy.
Frequently Asked Questions
1. How does data visualization help businesses make better decisions?
Data visualization transforms vast and complex datasets into easily understandable visual formats. This allows business users to quickly identify new patterns, trends, and potential data errors. A clear understanding of these insights enables them to make proactive decisions and focus on areas that require attention, ultimately leading to business growth and improved efficiency.
2. How can a company use data visualization to identify emerging trends?
By presenting data in visual formats like charts, graphs, and maps, businesses can more easily absorb and interpret information. This visual approach helps in spotting novel patterns and trends that might be missed in traditional tabular data. Tools like bubble charts, donut charts, and treemaps allow decision-makers to explore data from different perspectives, revealing new avenues for growth and innovation.
3. What is the importance of data visualization in sales management?
For sales teams, data visualization is crucial for quickly identifying patterns and trends that may require immediate action. For example, visualizing website traffic or sales figures over a specific period can instantly highlight significant changes. This allows sales managers to make timely adjustments to their strategies, allocate resources more effectively, and capitalize on emerging opportunities.
4. How does sales mapping software improve the ROI of sales efforts?
Sales mapping software provides a visual representation of sales data, allowing businesses to see where their most valuable customers are located and where their sales efforts are most effective. This enables them to optimize sales territories, target high-potential areas, and allocate resources more efficiently. By focusing on the most profitable opportunities, companies can significantly increase the return on investment of their sales activities.
5. Can data visualization help in identifying new market opportunities?
Absolutely. By mapping out current customer locations and sales data, businesses can identify geographic areas with a high concentration of potential customers that are currently underserved. This insight is invaluable for planning expansion strategies, such as opening new stores or launching targeted marketing campaigns in those regions, thereby tapping into new market opportunities.
6. What are some key features to look for in sales mapping software?
When choosing sales mapping software, look for features such as customizable territory design, real-time data integration, advanced filtering options (by demographics, purchase history, etc.), and robust analytical and reporting capabilities. The ability to create heat maps and other visual representations of data is also essential. User-friendliness and mobile accessibility are also important for ensuring adoption by your sales team.
7. How can small businesses benefit from sales mapping and data visualization?
Sales mapping and data visualization are not just for large corporations. Small businesses can use these tools to level the playing field by making smarter, data-driven decisions. They can identify niche markets, understand local customer behavior, and optimize their limited resources to achieve maximum impact. This allows them to compete more effectively with larger companies and achieve sustainable growth.
Ready to Transform Your Sales Strategy?
In the ever-evolving business landscape of 2026, harnessing the power of data is no longer optional—it’s essential for survival and growth. Sales mapping and data visualization offer a clear path to understanding your customers, optimizing your sales efforts, and unlocking new opportunities for scalability. Don’t let your business fall behind.
At Hir Infotech, we specialize in providing cutting-edge data solutions, including web scraping and data extraction, to help businesses like yours make sense of their data and turn it into a strategic asset. Our team of experts is ready to help you implement the tools and strategies you need to thrive in a data-driven world.
Contact us today to learn how Hir Infotech can help you leverage the power of data and take your business to the next level.
#DataVisualization #SalesMapping #BusinessScalability #DataAnalytics #SalesStrategy #BusinessGrowth #TechTrends2026 #DataDrivenDecisions #BigData #MarTech